
Preliminary Science Report Figure 5-24
Click on the image for a larger version.
Scan courtesy Stephen Tellier, Lunar and Planetary Institute
Click on the image for a larger version.
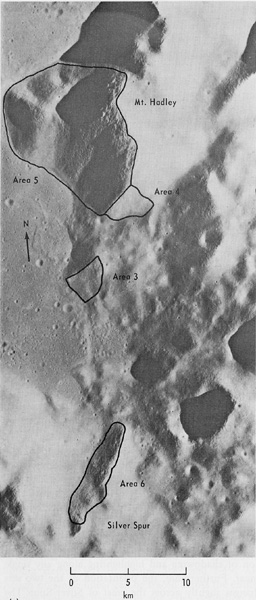
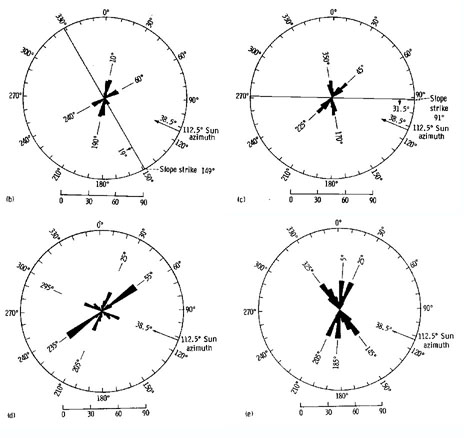
FIGURE 5-24.-Lineament azimuth-frequency plots and 1ocation maps of aleas 3 to 6. Scale represents number of lineaments plotted as a function of distance from origin; lineaments are plotted in 10 ¡ increments. (a) Orbital panoramic camera view taken with intermediate Sun (pan AS15-9425). (b) Plot of area 3 (1081ineaments). (c) Plot of area 4 (107 lineaments). (d) Plot of area 5 (166 lineaments). (e) Plot of area 6 (189 lineaments).