
Preliminary Science Report Figure 5-23
Click on the image for a larger version.
Scan courtesy Stephen Tellier, Lunar and Planetary Institute
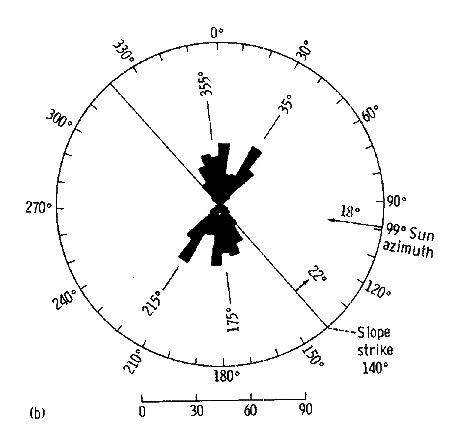
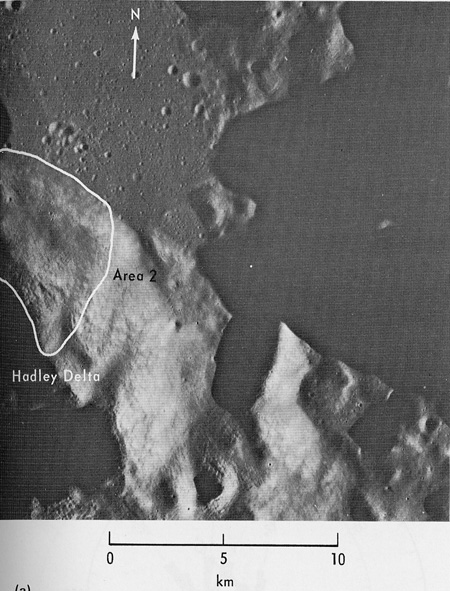
FIGURE 5-23.-Lineament azimuth-frequency plot and location map of area 2. Scale represents number of lineaments plotted as a function of distance from origin; lineaments are plotted in 10¡ increments.(a) Orbital panoramic camera view taken with low Sun (pan AS15-9375). (b) Plot of area 2 (252 lineaments)